Portfolio research & risk analytics
Yahoo Finance via yfinance · CAD · 03 Jan 2019 to 31 Aug 2026
Open research notebook · Download notebook
Portfolio comparison
Growth emphasizes technology. Income emphasizes banks, energy and utilities. Balanced diversifies across these equity sectors. Low volatility uses inverse historical volatility weights. All four remain equity portfolios.
| Portfolio Id | Cumulative Return | Annualized Return | Volatility | Sharpe | Max Drawdown | Total Cost | Excess Annualized Return |
|---|---|---|---|---|---|---|---|
| Balanced | 279.82% | 19.12% | 16.29% | 0.97 | -28.73% | $776.61 | 2.90% |
| Benchmark | 214.75% | 16.22% | 16.37% | 0.82 | -37.21% | $0.00 | 0.00% |
| Growth | 549.20% | 27.80% | 28.60% | 0.90 | -48.72% | $1,856.88 | 11.57% |
| Income | 212.94% | 16.13% | 16.06% | 0.83 | -33.06% | $395.51 | -0.09% |
| Low volatility | 243.59% | 17.57% | 15.29% | 0.94 | -29.71% | $573.68 | 1.34% |
How much could the investment lose?
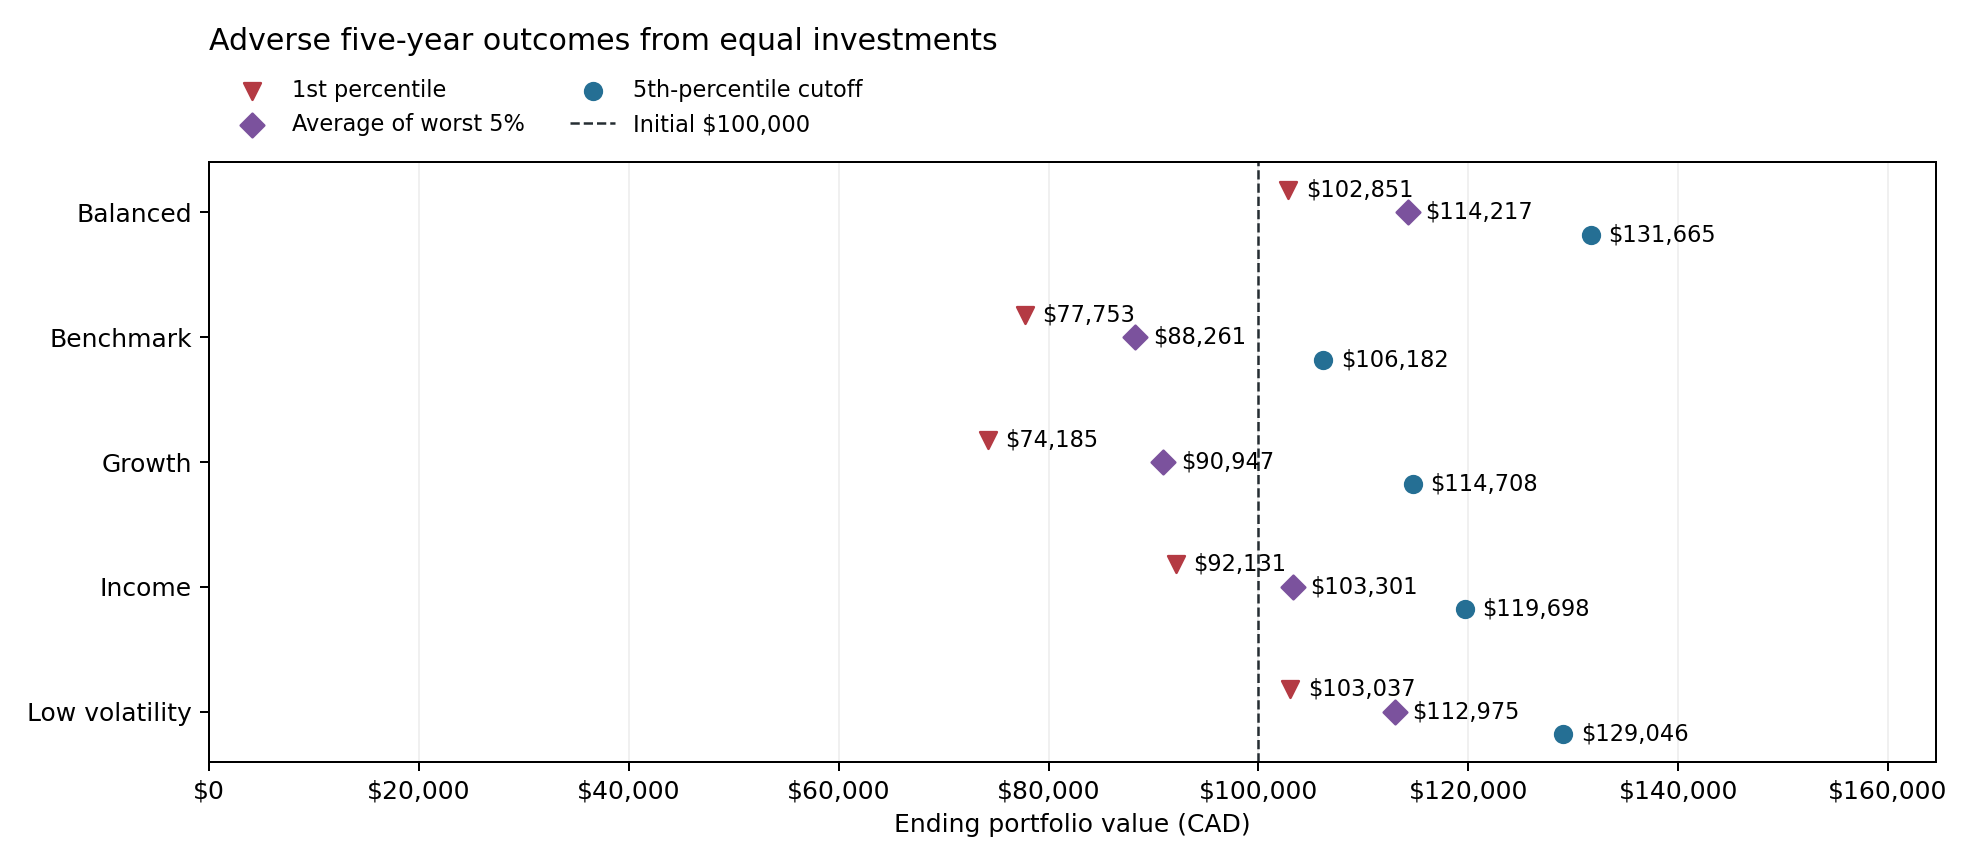
The lower fan boundary is a 5th-percentile cutoff: 5% of simulated ending balances lie below it. The average of that worst 5% describes the tail beyond the cutoff. Values below the initial CAD 100,000 represent losses of principal.
| Portfolio | 1st percentile | 5th percentile | Worst-5% average | Finish below initial capital | Ever lose over 20% of initial capital |
|---|---|---|---|---|---|
| Balanced | $102,851 | $131,665 | $114,217 | 0.72% | 8.80% |
| Benchmark | $77,753 | $106,182 | $88,261 | 3.92% | 16.12% |
| Growth | $74,185 | $114,708 | $90,947 | 3.08% | 24.24% |
| Income | $92,131 | $119,698 | $103,301 | 1.56% | 12.16% |
| Low volatility | $103,037 | $129,046 | $112,975 | 0.84% | 9.22% |
Growth versus Balanced in the same market scenarios
Subtract Balanced's ending value from Growth's in each shared simulated market sequence. Growth finishes below Balanced in 19.32% of paths. The median difference is $+91,045; the 5th-percentile difference is $-50,893. These are conditional simulation results.
Subtracting the portfolios' separate 5th percentiles does not give the 5th percentile of their difference. Their individual adverse outcomes need not occur in the same path. The paired shortfall is not a maximum loss.
What can happen before year five?
Does the conclusion survive different sampling assumptions?
All comparisons use 5,000 paths, seed 42, equal capital and the same completed history. Longer moving blocks retain longer sequences but underweight dates near the sample boundaries. Circular blocks wrap the end to the beginning, reducing that weighting effect while introducing artificial joins. The choice affects both dependence and sampled returns. No variant is selected because it produces a preferred ranking.
| Sampling assumption | Portfolio | 5th percentile | Median final value | Finish below initial capital |
|---|---|---|---|---|
| Published model | Balanced | $131,665 | $235,938 | 0.72% |
| Published model | Growth | $114,708 | $329,002 | 3.08% |
| 126-session moving blocks | Balanced | $140,104 | $217,691 | 0.30% |
| 126-session moving blocks | Growth | $90,882 | $283,667 | 6.22% |
| 252-session moving blocks | Balanced | $139,163 | $211,997 | 0.18% |
| 252-session moving blocks | Growth | $91,528 | $283,126 | 6.44% |
| 126-session circular blocks | Balanced | $152,114 | $244,540 | 0.18% |
| 126-session circular blocks | Growth | $111,727 | $360,857 | 3.60% |
| 252-session circular blocks | Balanced | $152,584 | $241,209 | 0.04% |
| 252-session circular blocks | Growth | $106,308 | $358,141 | 4.08% |
Research finding: Growth's historical return advantage makes its median attractive under these assumptions, while several measures show greater downside than Balanced. A positive 5th percentile does not rule out principal losses. Higher volatility alone does not require every lower percentile to rank worst. The future return distribution remains unvalidated, and changing sampling assumptions can change the conclusion.
The bootstrap can generate worse compounded outcomes than any observed historical path by repeating adverse blocks. It cannot establish probabilities for risks absent from the sample. The separate volatility-model holdout does not validate these five-year return scenarios.
Download downside metrics · Download paired comparisons · Download sampling sensitivity
Full percentile ranges
Historical wealth continuation (unequal balances)
This secondary view carries forward each historical ending balance. The primary comparison and scenario table use equal investments.
Five-year comparison: equal CAD 100,000 investments
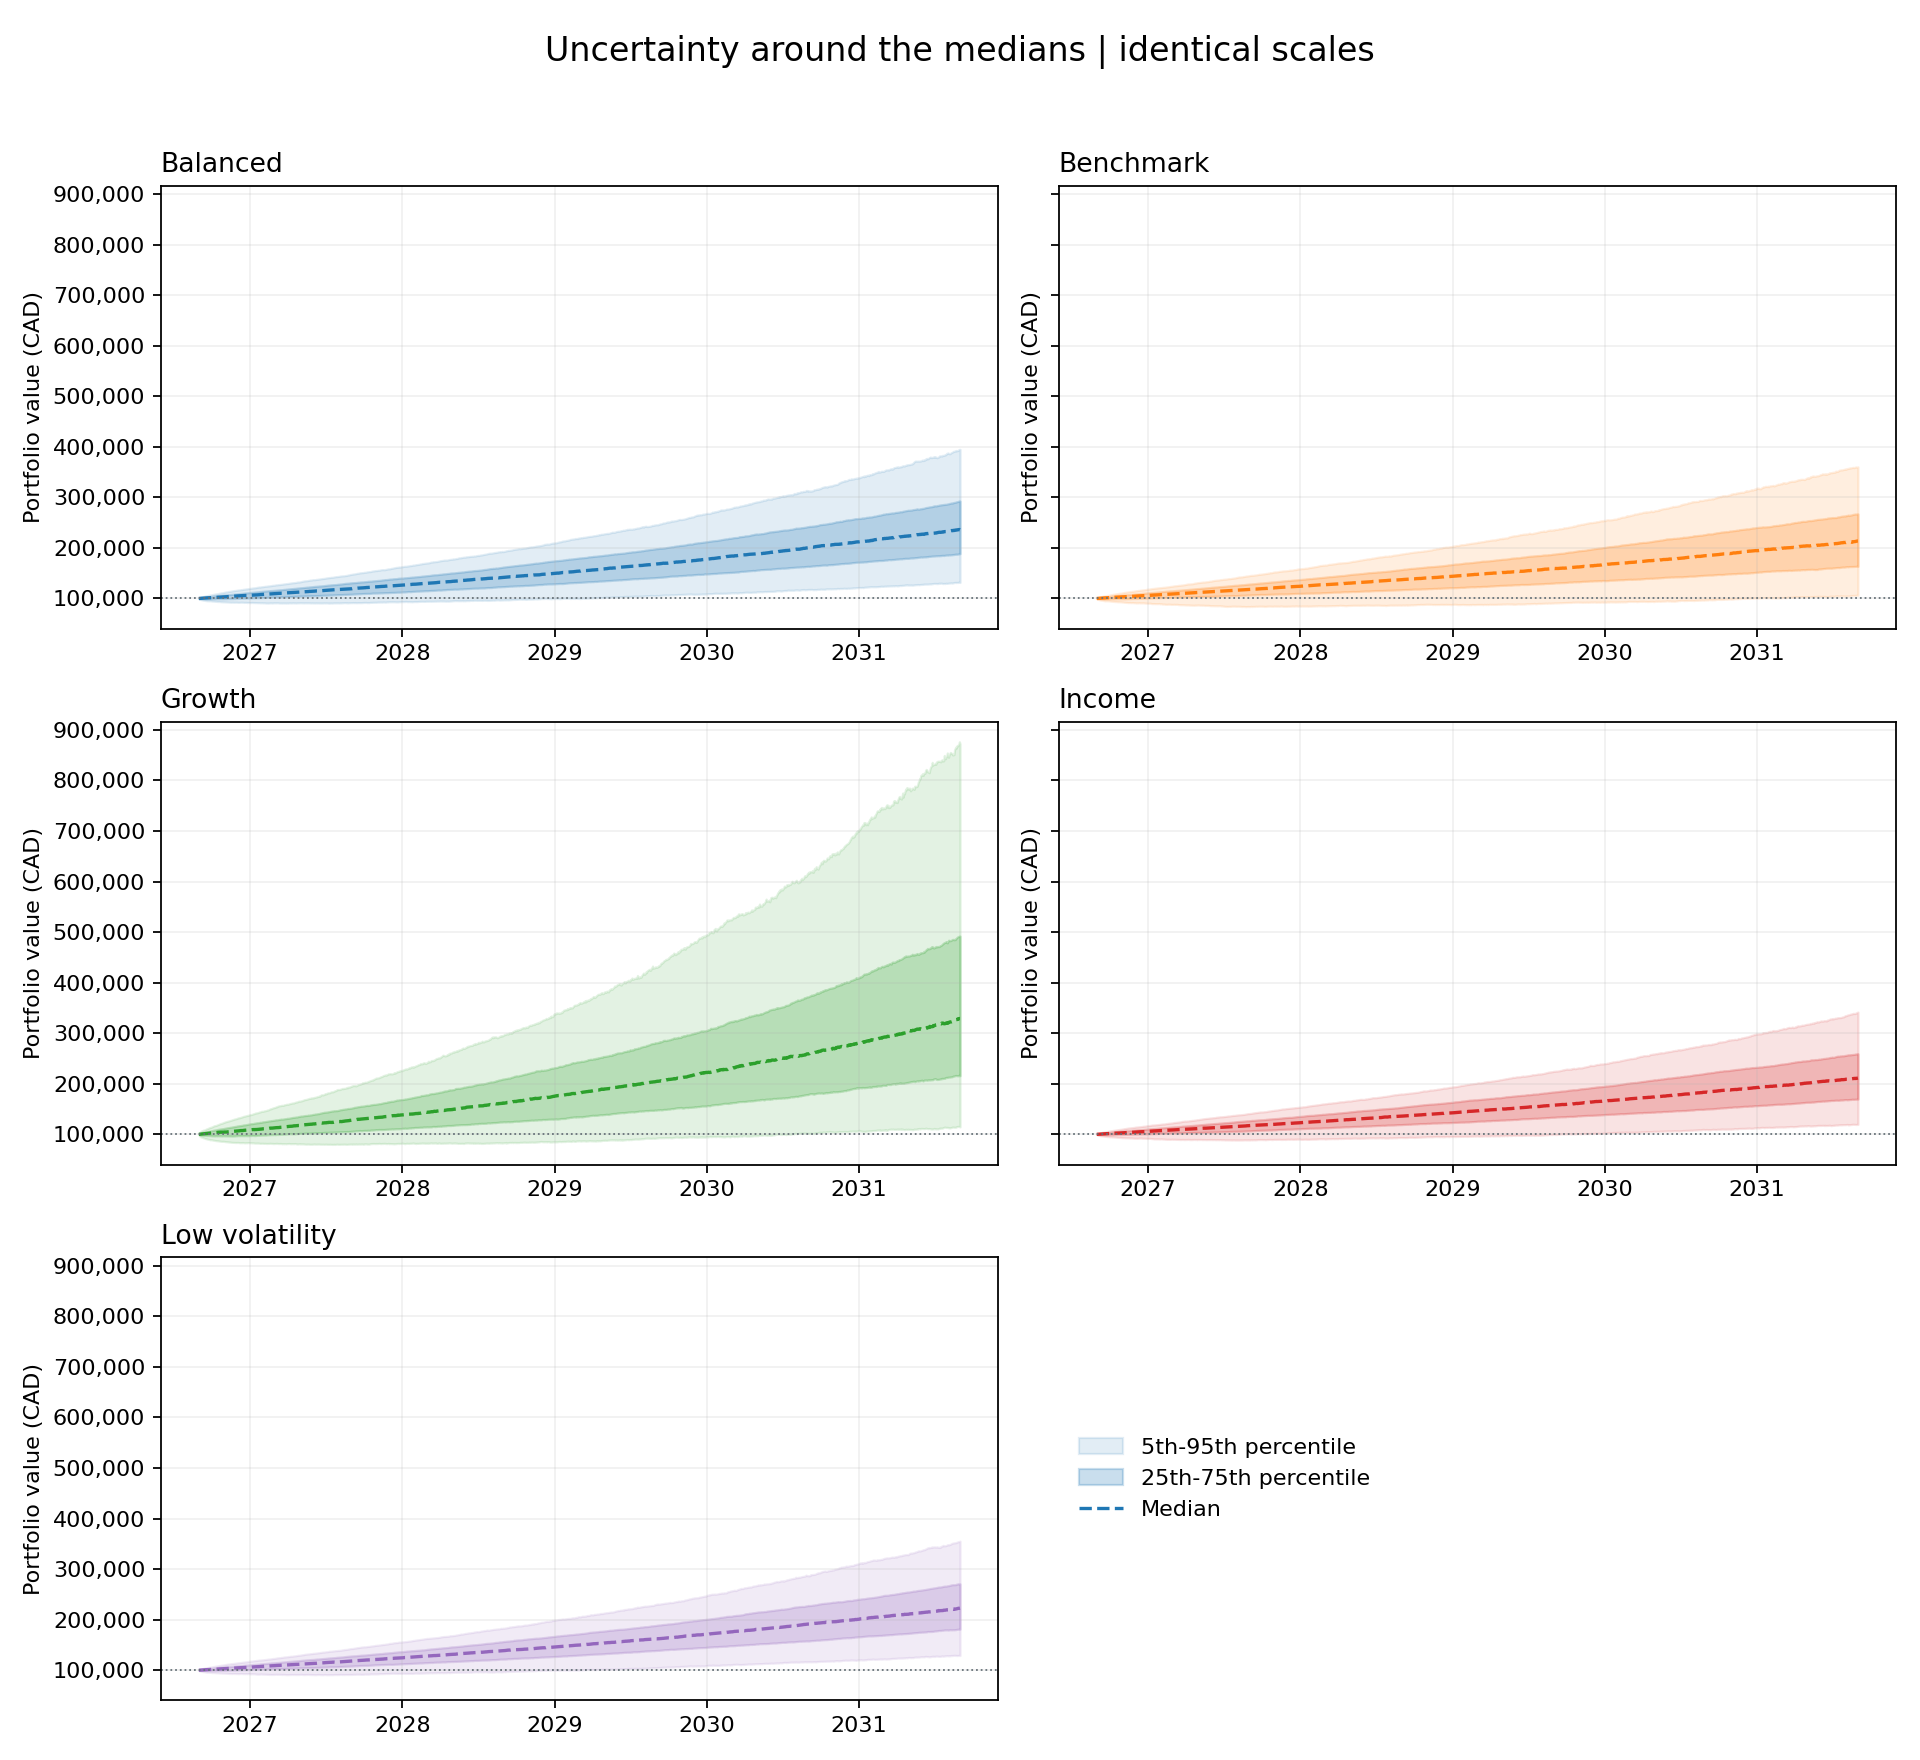
Every portfolio and XIC starts with CAD 100,000 after the final completed backtest date. The table, primary chart and exports all use this equal-capital basis. The secondary historical continuation rescales scenarios to each past ending balance. The engine resamples consecutive 20-session blocks of each portfolio's completed net returns, including modeled rebalancing costs, across 5,000 paths. This preserves some short-run return clustering while showing a distribution of plausible outcomes rather than a single expected-value promise.
These are conditional historical scenarios. All portfolios and XIC use the same sampled 20-session periods. The chart includes the initial value and ends exactly five calendar years later; 252 modeled sessions per year are mapped to that horizon, not to an exchange holiday calendar. Resampled net returns carry historical costs; future trades are not recomputed. Strong historical returns and today's selected securities can make projections optimistic. Bands omit parameter uncertainty and unseen market regimes. They use no returns after the projection start date and do not claim the historical sample will repeat.
| Portfolio | Historical end | Starting value | 5th percentile terminal value | Median terminal value | 95th percentile terminal value | Probability of loss after horizon | Median maximum drawdown | Paths | Years | Block days |
|---|---|---|---|---|---|---|---|---|---|---|
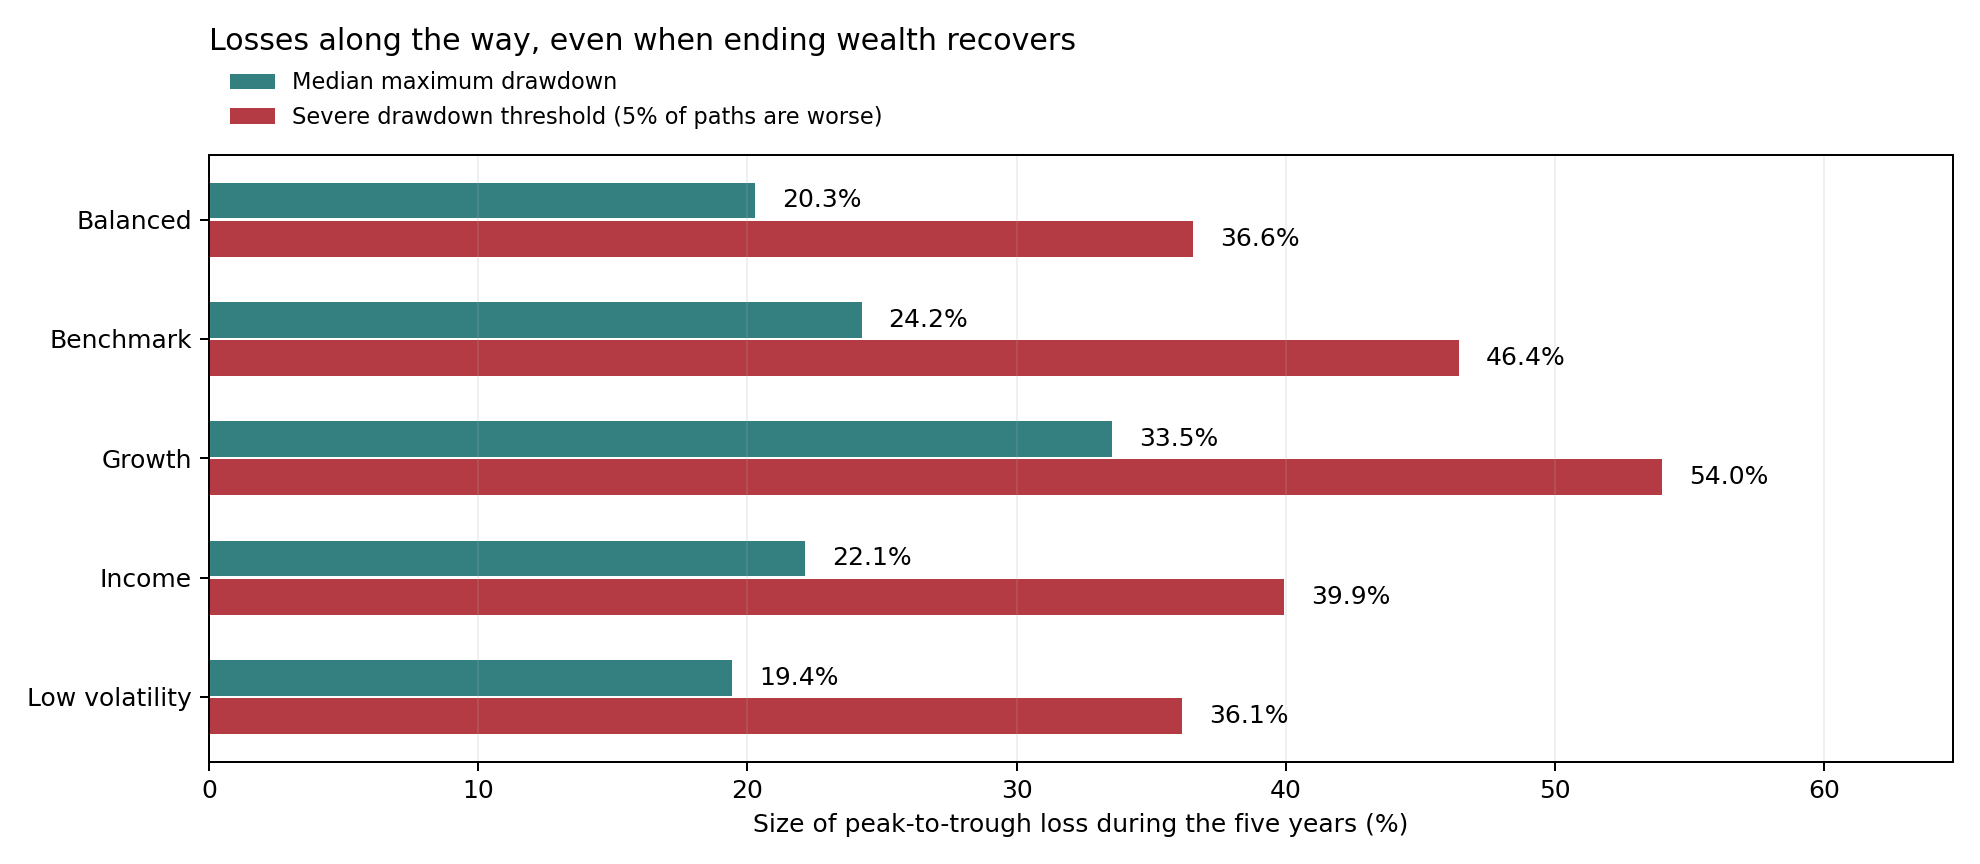
| Balanced | 31 Aug 2026 | $100,000 | $131,665 | $235,938 | $394,953 | 0.7% | -20.3% | 5000 | 5 | 20 |
| Benchmark | 31 Aug 2026 | $100,000 | $106,182 | $213,678 | $360,350 | 3.9% | -24.2% | 5000 | 5 | 20 |
| Growth | 31 Aug 2026 | $100,000 | $114,708 | $329,002 | $872,362 | 3.1% | -33.5% | 5000 | 5 | 20 |
| Income | 31 Aug 2026 | $100,000 | $119,698 | $211,349 | $341,758 | 1.6% | -22.1% | 5000 | 5 | 20 |
| Low volatility | 31 Aug 2026 | $100,000 | $129,046 | $222,660 | $355,250 | 0.8% | -19.4% | 5000 | 5 | 20 |
Forecast validation
Models predict the next 20 sessions' realized annualized volatility. Selection uses training-period cross-validation only. The last 20% is held out, with a 20-session gap to exclude overlapping training labels. A negative R² means the model is worse than predicting the test mean. Compare RMSE with persistence before concluding that machine learning helps.
| portfolio_id | model | rmse | r2 | selected_by_cv |
|---|---|---|---|---|
| Balanced | Linear regression | 0.0432 | -0.088 | False |
| Balanced | Ridge | 0.0418 | -0.020 | True |
| Balanced | Lasso | 0.0418 | -0.020 | False |
| Balanced | ElasticNet | 0.0421 | -0.033 | False |
| Balanced | Persistence baseline | 0.0498 | -0.449 | False |
| Growth | Linear regression | 0.0999 | -0.058 | False |
| Growth | Ridge | 0.0993 | -0.045 | True |
| Growth | Lasso | 0.0997 | -0.054 | False |
| Growth | ElasticNet | 0.0997 | -0.055 | False |
| Growth | Persistence baseline | 0.1314 | -0.830 | False |
| Income | Linear regression | 0.0358 | -0.383 | False |
| Income | Ridge | 0.0351 | -0.332 | True |
| Income | Lasso | 0.0352 | -0.339 | False |
| Income | ElasticNet | 0.0353 | -0.345 | False |
| Income | Persistence baseline | 0.0312 | -0.049 | False |
| Low volatility | Linear regression | 0.0370 | -0.210 | False |
| Low volatility | Ridge | 0.0360 | -0.145 | True |
| Low volatility | Lasso | 0.0360 | -0.143 | False |
| Low volatility | ElasticNet | 0.0362 | -0.153 | False |
| Low volatility | Persistence baseline | 0.0398 | -0.396 | False |
Methodology and limitations
Adjusted closes approximate reinvested total returns. Position units are synthetic adjusted-price units, not broker share balances. Portfolios begin after a 252-session calibration period and rebalance at the close of each month's first trading session. The benchmark is XIC.TO, a broad Canadian equity ETF held without rebalancing. Returns use previous-close weights and deduct 10 bps on total absolute traded weight. Initial entry costs, taxes and additional market impact are excluded.
Backtest timing and look-ahead controls. The Low Volatility target weights are calibrated once using only the first 252 completed sessions; subsequent prices cannot affect those weights. On each later date, the portfolio return is calculated from the weights held at the previous close. A monthly rebalance occurs only after that day's return and transaction cost have been booked, so it applies to future returns rather than the same day's already-known move. The forecast models use features available through date t and labels composed only of returns from t+1 onward. The final 20% is held out, and a 20-session purge separates the last training label from the test period. Scaling and parameter selection occur within training folds only.
Sharpe uses arithmetic mean daily excess return divided by daily standard deviation, annualized with √252. Annualized return uses compound growth. The constant annual risk-free assumption is 3.0%. Income is a sector allocation label: dividend yield and cash distributions are not modeled separately. Today's chosen security universe creates selection and survivorship bias. Low-volatility weights are calibrated once and need not deliver the lowest future risk. Overlapping forecast targets mean test errors are dependent; no statistical significance or trading profitability is claimed.
Forecasts are a separate research experiment and do not drive portfolio allocations. Forward scenarios start after the final backtest date and resample only completed portfolio returns; they are not an out-of-sample forecast of returns. Financial data and model outputs remain reviewable in the SQL mart and exported CSV files.
Run configuration and provenance
{
"configuration": {
"start": "2018-01-01",
"end": "2026-09-01",
"benchmark": "XIC.TO",
"initial_capital": 100000,
"risk_free_rate": 0.03,
"transaction_cost_bps": 10,
"warmup_days": 252,
"forecast_days": 20,
"test_fraction": 0.2,
"simulation_years": 5,
"simulation_paths": 5000,
"bootstrap_block_days": 20,
"trading_days": 252,
"seed": 42
},
"provenance": {
"source": "Yahoo Finance via yfinance",
"retrieved_at": "2026-09-09T05:52:46.940726+00:00",
"sha256": "b44f2f6710ea5c813e3c598cd6594adab2596f9a5bf8c00f4734f6ccca092bb4",
"start": "2018-01-01",
"end_exclusive": "2026-09-01",
"price_basis": "Dividend/split adjusted close; CAD"
},
"validation": {
"exact_duplicates_removed": 0,
"missing_prices": 0,
"price_records": 19575,
"securities": 9,
"dates": 2175
}
}