Current focus / Machine-learning equity research
AlphaCast
A research workstation that ranks 98 US large caps by their expected return against their own sector over the next 20 trading sessions, tests six models (five plus an ensemble) on the same walk-forward folds, and turns the ranking into a portfolio it keeps monitoring.
- Test window
- Feb 2017 – Jul 2026
114 monthly folds, out of sample - Universe
- 98 US large caps · 11 sectors
daily data 2014 – 2026 - Models
- Momentum baseline · Ridge
Elastic Net · Random Forest
Gradient Boosting · Ensemble - Stack
- Python · pandas · scikit-learn
FastAPI · JavaScript · pytest
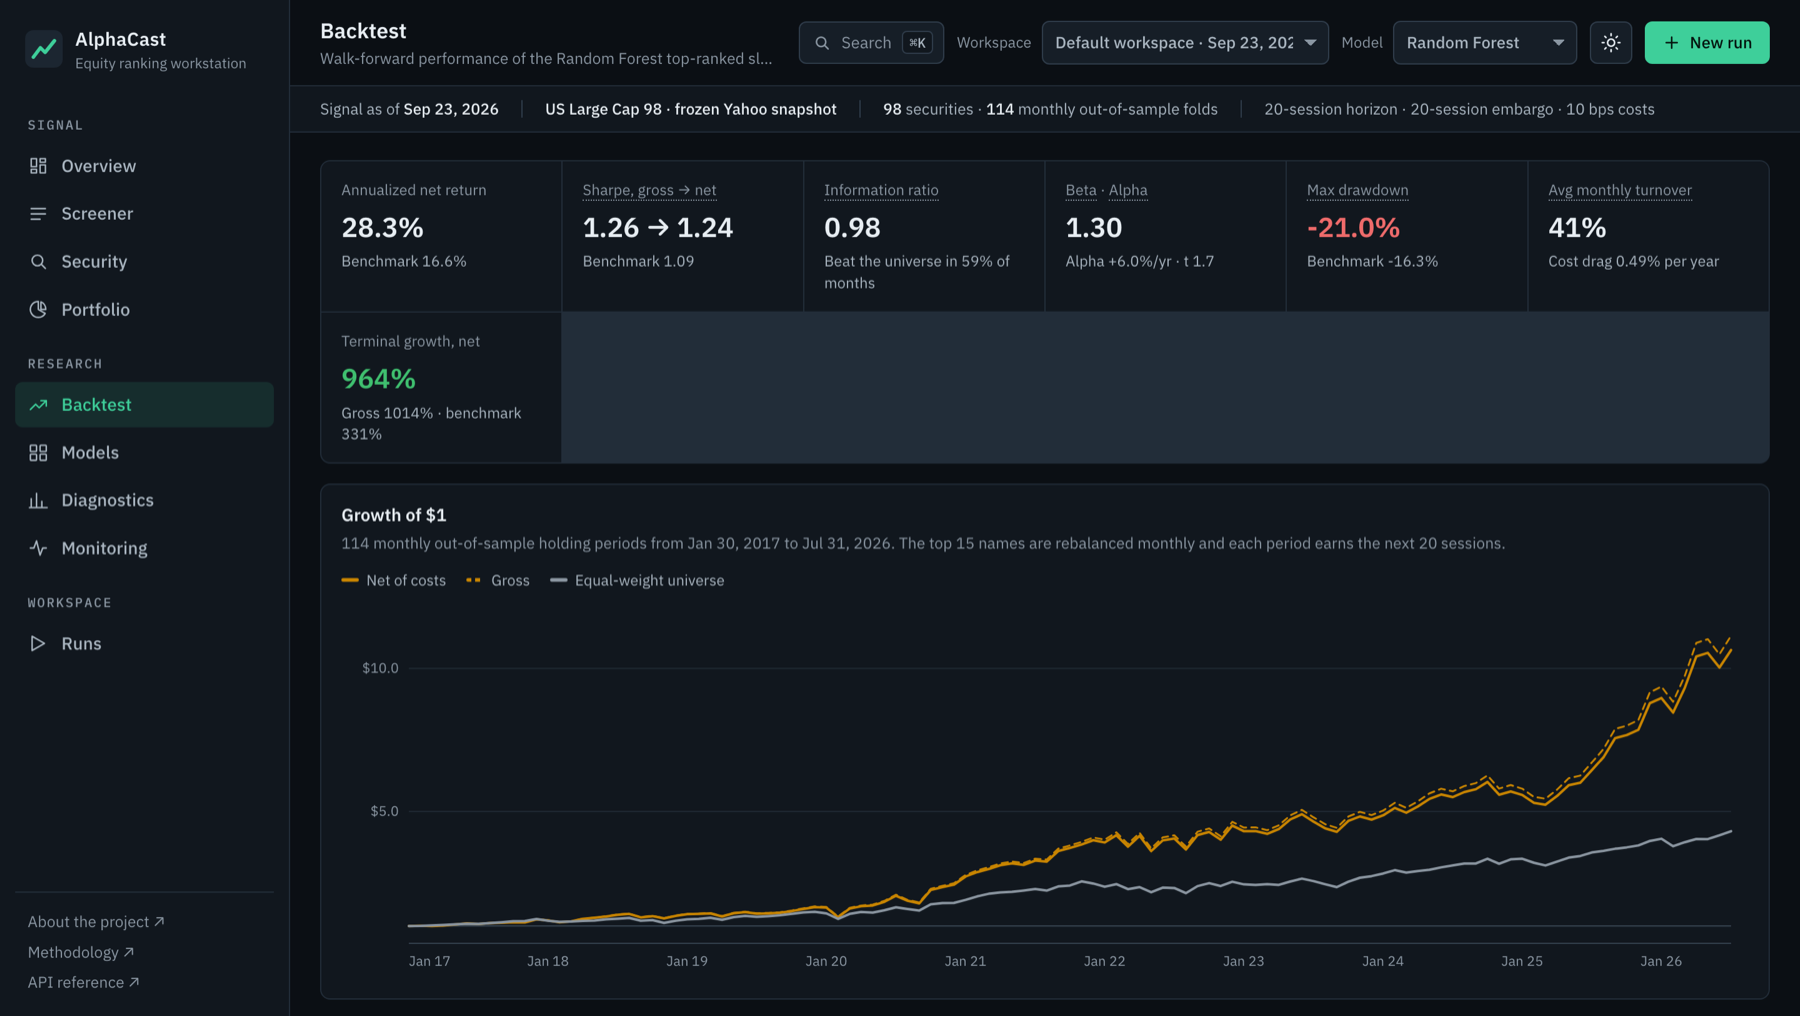
Random Forest top-15 equal-weight sleeve, rebalanced monthly, net of 10 bps one-way costs on 41% average monthly turnover. Walk-forward, out of sample, Feb 2017 – Jul 2026. Benchmark: the equal-weight universe over the same periods.
The thirty-second version
The signal is small, and only suggestive
Random Forest ranked stocks with a mean Rank IC of 0.024, positive in 59% of 114 months, the only t-statistic above 2 (p = 0.018; bootstrap 95% interval 0.005 to 0.045). Adjusted for testing six models, p rises to 0.11. That is typical of real equity signals: useful as a tilt, nowhere near a forecast.
Most machine learning did not beat momentum
Ridge, Elastic Net and gradient boosting all reached about 0.010 IC, above momentum's 0.006 but within noise, and after turnover their Sharpe ratios fell below momentum's 1.22. The machine-learning sleeves also carry more market risk (beta 1.2 to 1.4), which flatters them in a rising decade. Model complexity was not what made the difference.
It works in stress and fades in calm markets
In high-volatility months (53 of them) Random Forest's IC averaged 0.055; in calm expansions (60 months) it was -0.004. The monitoring view currently puts all six models on watch: each has a weaker last six months, but no drop exceeds 1.5 standard errors, so none is called degraded. The app shows this rather than hiding it.
The application
Built as software people use, not a notebook
The live app opens on the latest signal, precomputed from a Yahoo Finance snapshot that refreshes weekly, so the first screen loads instantly. New studies run in the background with time estimates, a command palette (⌘K) jumps to any stock or view, and every table exports.
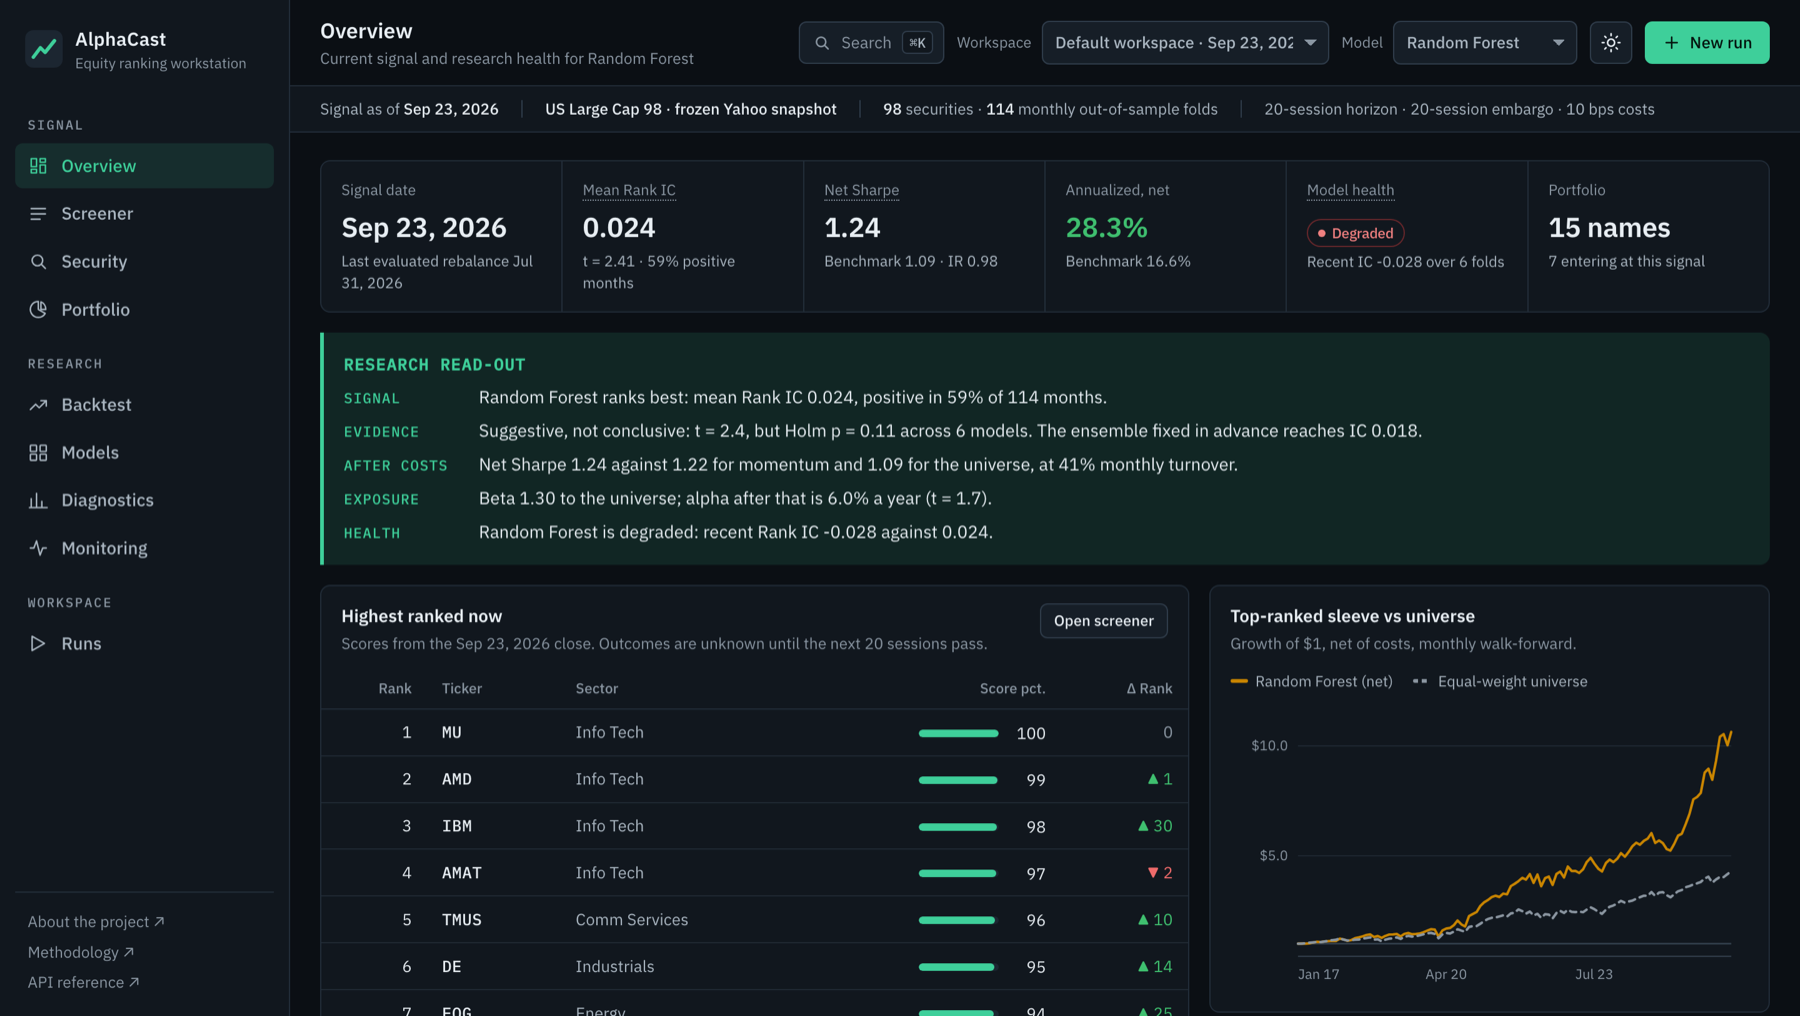
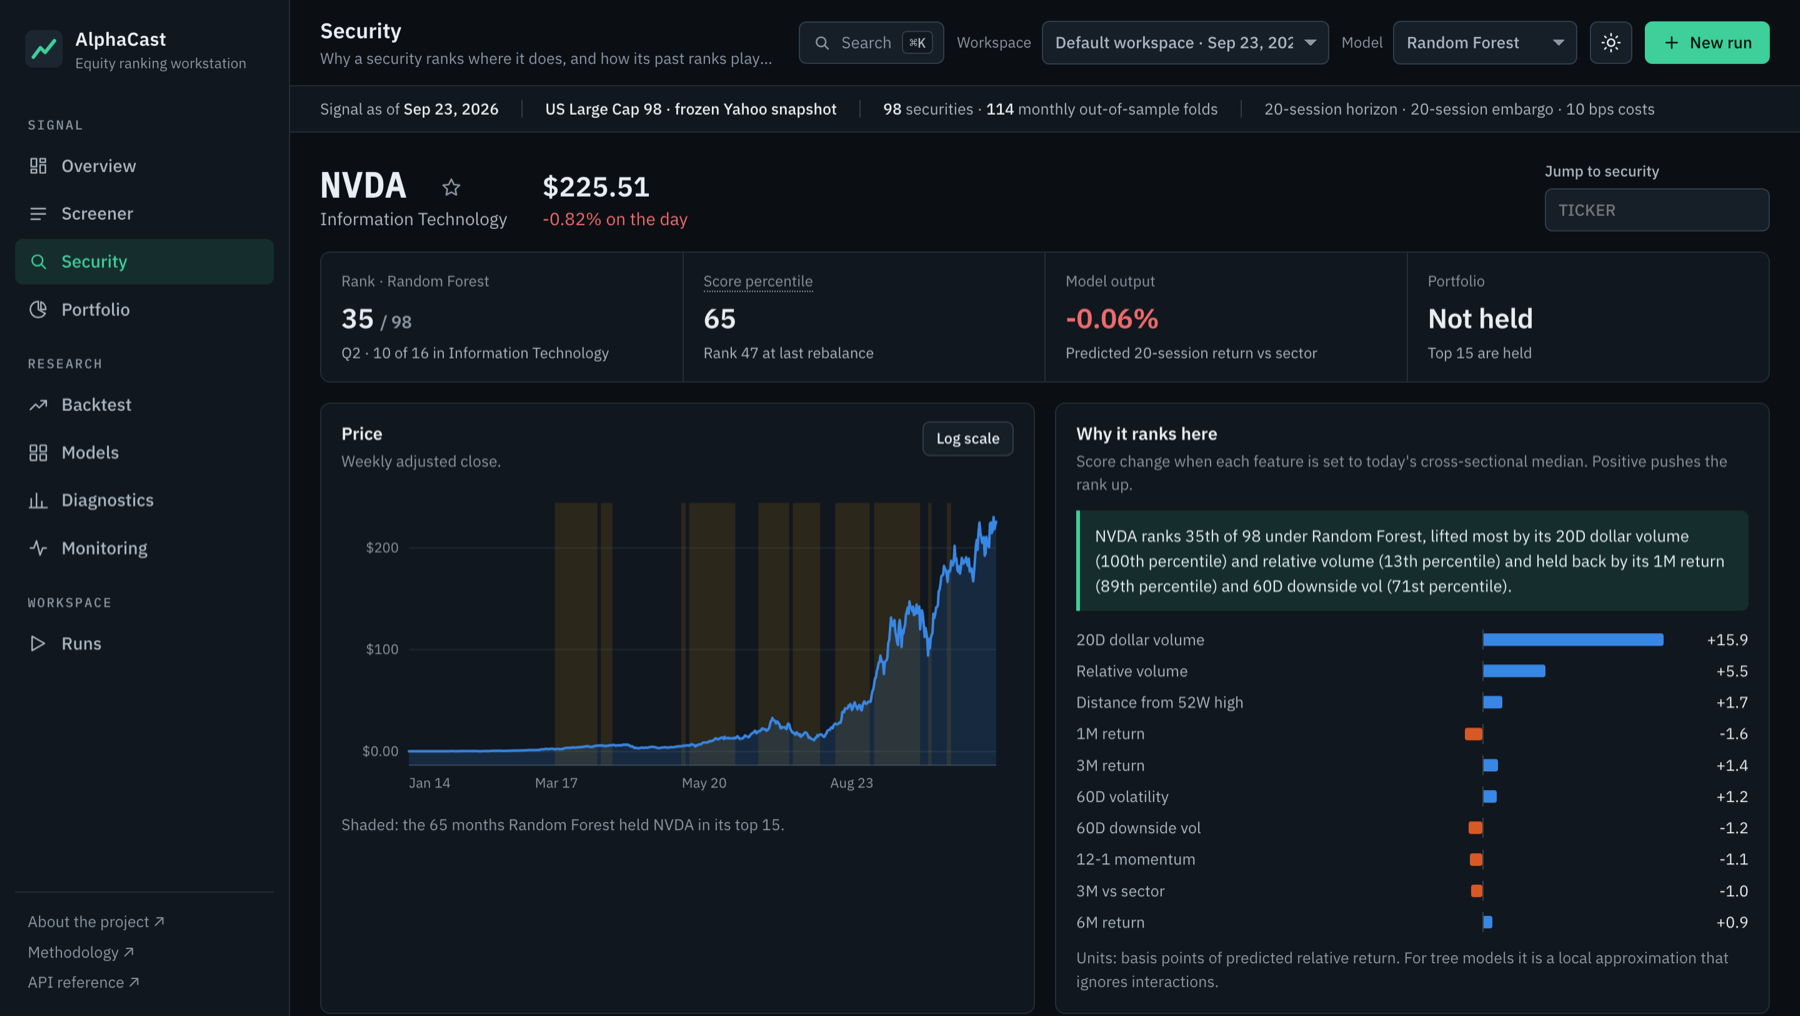
Overview & Screener
Today's ranks with factor profiles, model consensus, rank changes, filters, a watchlist and CSV export.
Security
Per-feature attribution, rank history against realised outcomes, rank under every model, sector peers.
Portfolio
The top-15 book at the latest close: entries and exits, turnover and cost, sector and factor tilts, optional sector cap.
Backtest & Diagnostics
Growth, drawdowns, cost break-evens, monthly IC, quintiles, within-sector skill and regimes.
Models
Six models on identical folds: IC, t-stat, Sharpe, turnover, today's rank agreement and feature reliance.
Monitoring & Runs
Health status, rolling IC bands, reliance and feature drift; background runs on live Yahoo data.
Out-of-sample performance
What $1 in the top-ranked sleeve became
Each month the model ranks all 98 stocks using only data up to that close, the top 15 are held equally for the next 20 sessions, and trading costs are charged on every change. Log scale, so equal slopes mean equal percentage growth.
Did machine learning help?
Six models, one set of folds, one bar to clear
A 12-1 momentum ranking needs no fitting, so it is the honest baseline. Every model saw the same features, the same folds, the same portfolio rule and the same costs. The cumulative IC chart shows whether an edge was persistent or came from a few lucky months.
Cumulative monthly Rank IC
| Model | Mean IC | t-stat | p (Holm) | IC > 0 | Q1 − Q5 | Net Sharpe | Turnover | Max DD |
|---|---|---|---|---|---|---|---|---|
| Random ForestStrongest | 0.024 | 2.41 | 0.11 | 59% | 0.80% | 1.24 | 41% | −21.0% |
| Ensemble (declared in advance) | 0.018 | 1.64 | 0.52 | 57% | 0.50% | 1.07 | 42% | −22.8% |
| Gradient Boosting | 0.010 | 0.97 | 1.00 | 45% | 0.33% | 1.06 | 57% | −22.8% |
| Elastic Net | 0.010 | 0.80 | 1.00 | 49% | 0.38% | 0.90 | 35% | −23.3% |
| Ridge | 0.010 | 0.75 | 1.00 | 50% | 0.41% | 0.80 | 46% | −27.4% |
| Momentum 12-1 (baseline) | 0.006 | 0.37 | 1.00 | 54% | 0.23% | 1.22 | 25% | −21.1% |
| Equal-weight universe | — | — | — | — | — | 1.09 | — | −16.3% |
When does it work?
The signal is not stationary
Each month is labelled using only trailing information: the universe's 63-session return sets expansion or contraction, and 20-session volatility above the training window's median sets high volatility. These labels are diagnostics, never inputs or tuning targets.
| Regime (Random Forest) | Months | Mean IC | IC > 0 | Monthly active return |
|---|---|---|---|---|
| Expansion / low vol | 60 | -0.004 | 47% | +0.50% |
| Expansion / high vol | 29 | 0.059 | 76% | +1.57% |
| Contraction / high vol | 24 | 0.051 | 67% | +1.14% |
| Contraction / low vol | 1 | 0.106 | 100% | +1.28% |
Rank IC by forward horizon
Costs and concentration
How much trading and concentration the edge can carry
Every period stores gross return and turnover, so net results can be rebuilt at any trading cost. The same history shows where the ranking works inside each sector and where the top-ranked sleeve leans.
Net Sharpe against one-way trading cost
| Sector (Random Forest) | Names | Within-sector IC | IC > 0 | Active weight |
|---|---|---|---|---|
| Energy | 6 | 0.016 | 49% | +9.2% |
| Information Technology | 16 | 0.043 | 52% | +3.7% |
| Real Estate | 4 | -0.035 | 44% | +2.8% |
| Materials | 5 | 0.010 | 51% | +2.4% |
| Consumer Discretionary | 10 | 0.052 | 57% | +1.4% |
| Industrials | 10 | 0.013 | 47% | +0.4% |
| Communication Services | 8 | 0.068 | 58% | −1.7% |
| Utilities | 4 | -0.109 | 39% | −1.8% |
| Financials | 12 | -0.006 | 47% | −4.3% |
| Health Care | 14 | 0.046 | 62% | −5.9% |
| Consumer Staples | 9 | -0.026 | 41% | −6.4% |
How it works
From daily prices to a monitored portfolio
Point-in-time panel
Adjusted prices and volume for 98 stocks. A quality gate drops sessions Yahoo published for under 90% of the universe.
14 trailing signals
Momentum, risk, liquidity and sector-relative strength, ranked within each date so decade-long level drift cannot leak in.
Embargoed walk-forward
Expanding windows stop 20 sessions before each test month. Weekly-sampled training, quarterly refits, winsorised labels.
API and workstation
Background runs, live scoring, attribution, drift and health checks served to a dependency-free JavaScript app.
Validation
Why the numbers can be trusted, and where they cannot
Leakage controls
Every label starts after its decision
Features use data through the decision close; the 20-session target starts the next session; training ends 20 sessions before each test date so labels never overlap. Stale quarterly fits can only be older, never newer.
Tested: embargo, month-end folds, sampler equivalence, and a shuffled-data placebo that must show no skillEngineering
Bugs found by inspecting the data
Building the app surfaced a forward-return shift that crossed ticker boundaries, a Yahoo session published for 28 of 98 stocks, and a truncated final month counted as a fold. Each is fixed and covered by a regression test.
46 pytest cases · interface tests · axe accessibility audit · CI on every pushDeliberately not claimed
What this cannot show
The universe is today's large caps, so results carry survivorship bias. There are no point-in-time fundamentals, delisting returns, borrow costs, taxes or market-impact model, and no portfolio optimizer.
Stated in the app, the README and hereExplainability
Attribution for every ranked stock
Each score is decomposed by setting one feature at a time to the day's median. The decomposition is exact for the linear models and a local approximation for trees; reliance is compared across models on one scale.
Occlusion attribution · reliance driftNext research iteration
Strengthen the data before expanding the claim
Point-in-time constituents to remove survivorship bias, point-in-time fundamentals, and a spread and impact cost model. Each goes through the same chronological validation before it can support a stronger conclusion.
Quantitative research
Cross-sectional signal design, rank IC and quintile analysis, walk-forward validation with an embargo, regime diagnostics.
Machine learning
Six comparable models including an ensemble fixed in advance, declared hyperparameters, label winsorisation, occlusion attribution, placebo tests and drift monitoring.
Software engineering
Background job API, multi-view JavaScript workstation, performance profiling, tests, CI and Docker deployment.
Try it
Open the workstation and inspect today's ranks
The free instance may take a minute to wake up. Nothing in AlphaCast is investment advice.