Nathan Gomes

Site reliability · MLOps · Applied AI

ReliabilityML

An incident intelligence platform on simulated telemetry. It decides when something is wrong, names the likely cause or admits it doesn't know, tracks error budgets, answers troubleshooting questions only from approved runbooks, and gates releases and model promotions on measured evidence.

The project question: can a small platform shorten the path from a raw alert to a decision an engineer can trust, and show honestly where machine learning beats a well-written rulebook and where it doesn't?

Built for
Site reliability, MLOps and AI platform engineering roles
Stack
Python, scikit-learn, MLflow, FastAPI, Prometheus, Grafana, React, Terraform
Evaluation
A held-out test week on a different random seed; every model compared with a baseline
Data
Synthetic services, telemetry, incidents, runbooks and postmortems
Time to detect

2.8 minmedian, 95% of incidents caught, no false alerts in the test week

Classifier

0.96macro F1 on real alerts, vs 0.83 for rules written from the runbooks

Unseen failure

5 of 5held-out memory-leak alerts routed to "unknown", not guessed

Assistant

80%of unanswerable questions refused, with no answerable ones refused
01

The problem

Alert fatigue, slow root-cause analysis, and runbooks nobody can find.

On-call engineers lose time in three places: alerts that fire on harmless blips, the first minutes spent working out what kind of failure this is, and hunting for the runbook section that says what to do. A confident wrong answer in any of the three is worse than none, so every automated step here has to show its evidence and know when to stay quiet.

Telemetry generator5 services, 15 s signalsfaults + ground truth Feature windows1- and 5-minute, causal Detectionrobust EWMA vs Isolation Forest Classificationforest + open-set guard vs rules SLO enginebudgets, burn-rate alerts Model registryMLflow, drift-gated RAG assistantcited answers, refusals FastAPI + console8 endpoints, deploy gate Prometheus + Grafana4 dashboards, OTel traces

Foundation

Telemetry hard enough to mean something

Five services emit latency, errors, load, logs and traces every 15 seconds. Faults propagate through the call graph, so database saturation raises upstream errors and a traffic spike looks like saturation. 88% of deploys are harmless, and short noise spikes are not incidents.

NumPypandasSeeded

Honest evaluation

Four datasets, four jobs

30 training days, a 7-day test week on a different seed, a 30-day production replay with a realistic incident rate for SLOs, and a post-upgrade period for drift. One failure type is kept out of training entirely.

Held-out testTime splits

Engineering

Built like a small production service

28 tests at 90% coverage, including leakage tests and API contract tests. CI runs lint, types, tests, the deployment gate, Terraform validation and a Docker smoke test on every push.

pytestGitHub ActionsDocker
02

Detection

Alerting faster usually means more false alarms. The curve makes the trade-off explicit.

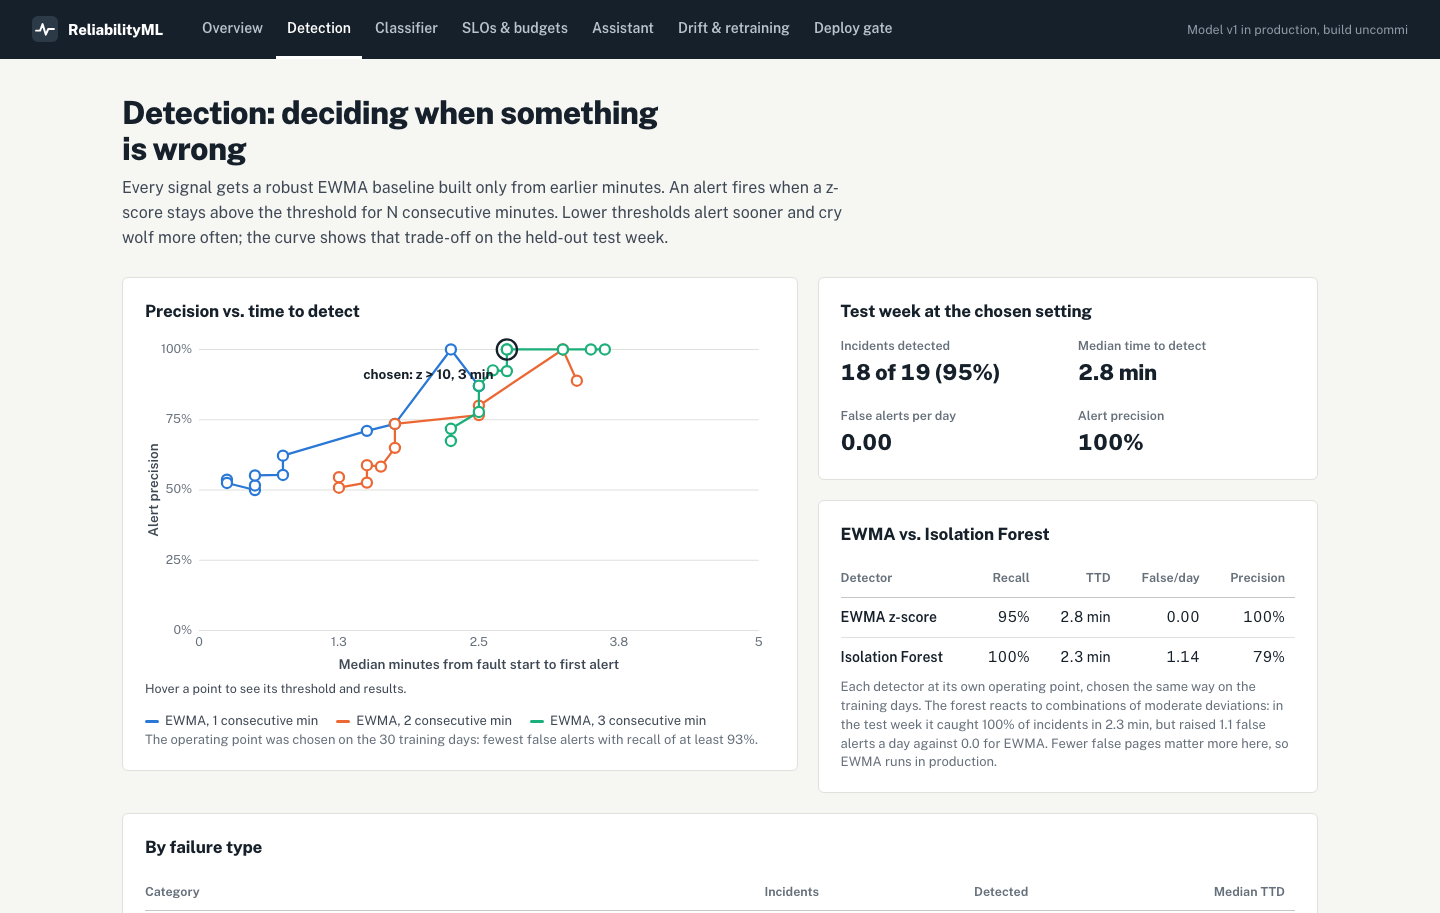
Each signal gets a robust EWMA baseline built only from earlier minutes. A first version missed large error spikes because the incident inflated its own baseline; clipping each value before it updates the baseline fixed that. The operating point was chosen on the training days, then scored once on the test week.

Precision against median time to detect for three consecutive-minute settings, with the chosen operating point marked, and a comparison with an Isolation Forest
Precision vs. time to detect. At z > 10 for 3 minutes: 18 of 19 incidents caught, 2.8-minute median, no false alerts in the test week. The Isolation Forest caught every incident slightly sooner but raised about one false alert a day.

The weak spot, stated plainly: memory leaks climb slowly enough that an adapting baseline treats them as normal. They are caught only when containers start restarting, hours in. A trend detector on memory is the next improvement.

03

Classification

The model beats the rulebook, and says "unknown" for the failure it never saw.

A random forest trained on four failure types, compared with if/then rules written from the runbooks. The rules even include a memory-leak rule the model never had. Confidence alone was not enough to catch the unseen type: the forest labelled most leak windows as traffic spikes with high confidence. A novelty guard, which measures distance to the nearest training examples, fixed it.

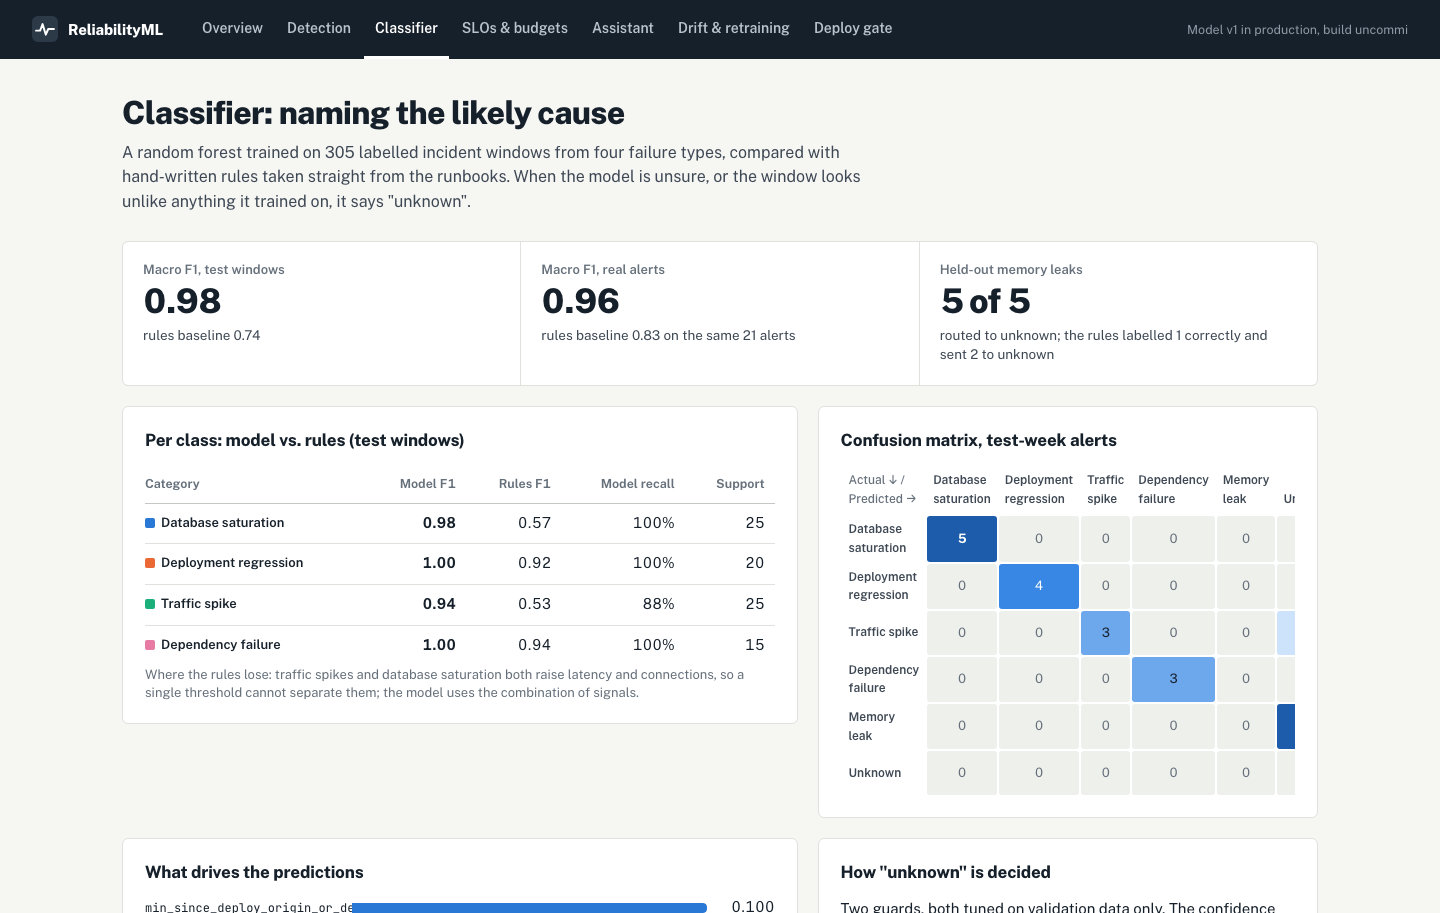
Per-class F1 for model and rules, confusion matrix and feature importance
Model vs. rules. Macro F1 0.98 vs 0.74 on incident windows, 0.96 vs 0.83 on real alerts. The rules struggle where traffic spikes and saturation share symptoms.
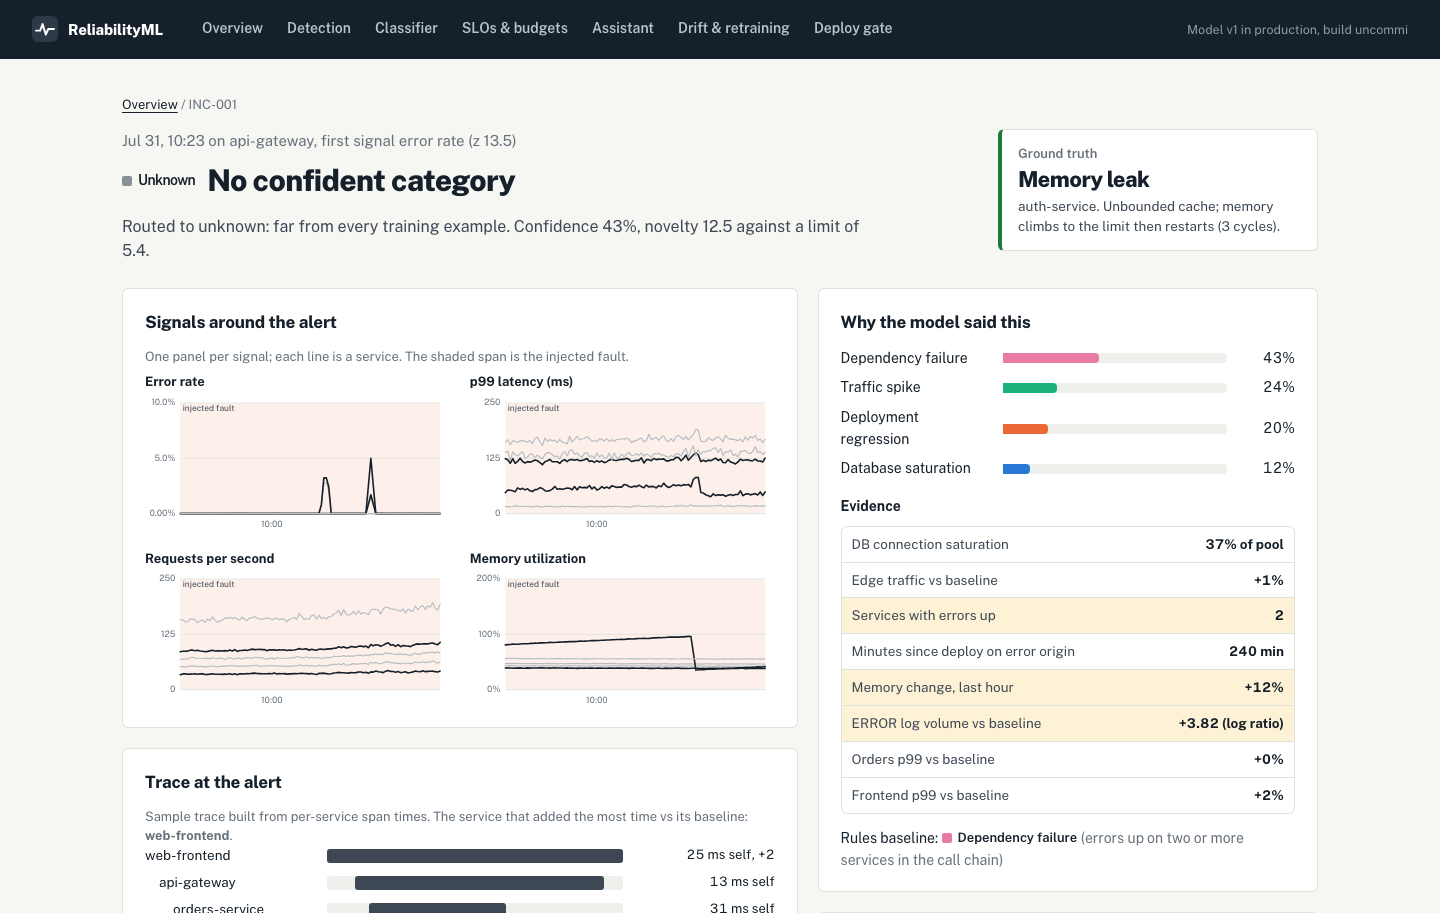
An incident routed to unknown, with class probabilities, evidence, ground truth memory leak and a cited runbook answer
An unseen failure. Routed to unknown because it is far from every training example; the assistant then points to the unclassified-alert triage runbook.
04

SLOs and error budgets

Page on fast budget burn, not on every blip.

99.9% availability and 99% of requests under 300 ms, each over 30 days. Alerts use the multi-window burn-rate rules from the Google SRE Workbook: a page fires only when both the long and the short window burn faster than the threshold. The budget also drives release policy: below 25% remaining, only urgent fixes ship.

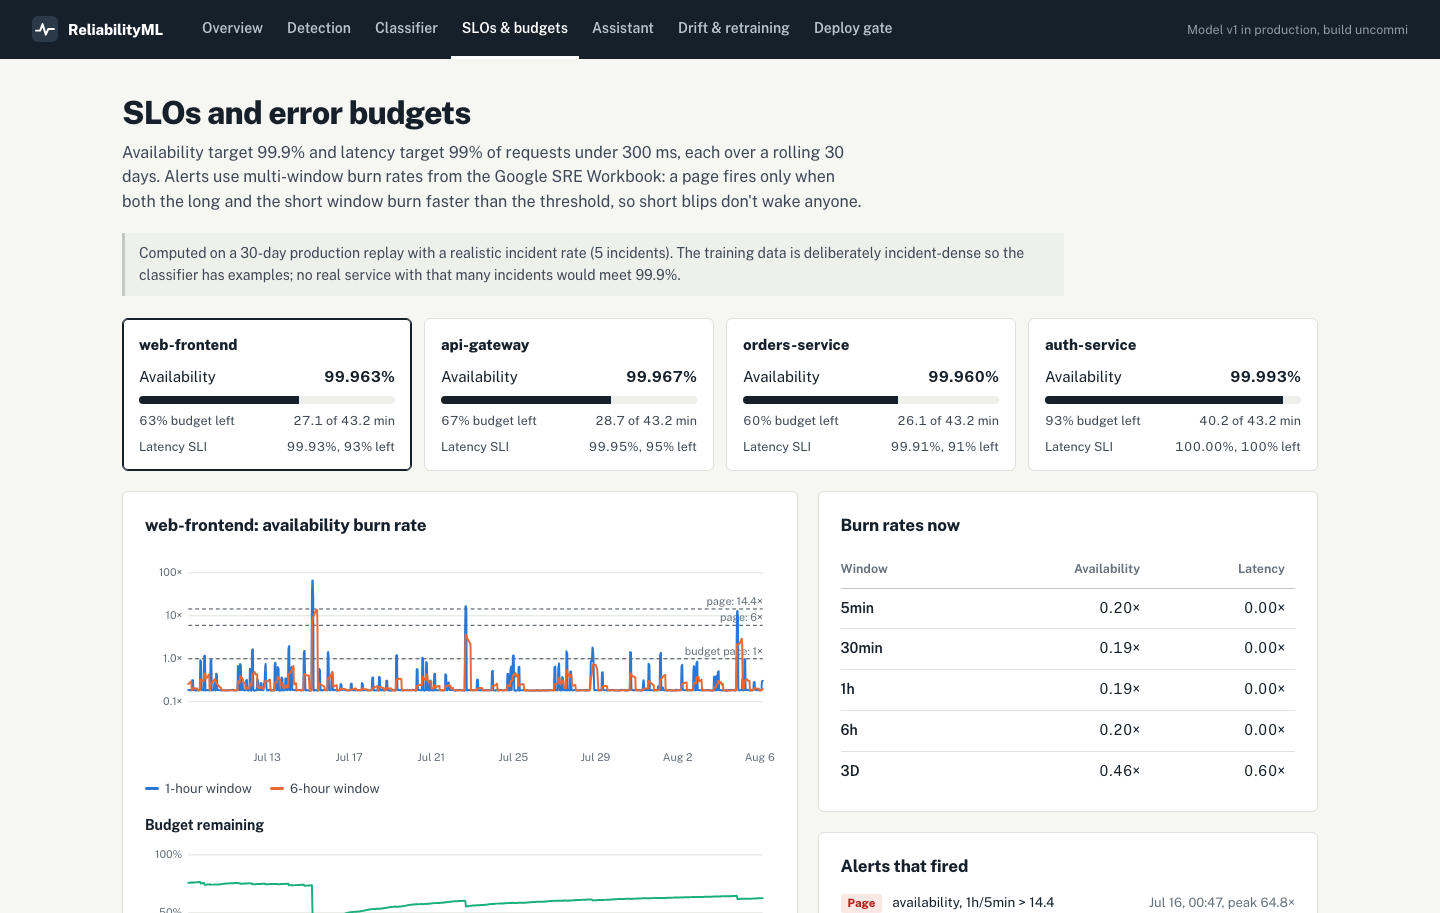
SLO cards per service, burn-rate chart with page thresholds, remaining budget and the alerts that fired
Error budgets over a 30-day production replay. 60–93% of budget left across services; 16 burn-rate alerts fired, every one during an incident. The same numbers are exported to Prometheus and four Grafana dashboards.
05

Troubleshooting assistant

Cited answers from approved runbooks, or a plain refusal.

Seventeen synthetic runbooks, postmortems and policies are split by section. Every sentence of an answer cites the section it came from, and code rejects any answer that cites something it did not retrieve. When the evidence is weak it replies "I couldn't find this in the approved runbooks or postmortems."

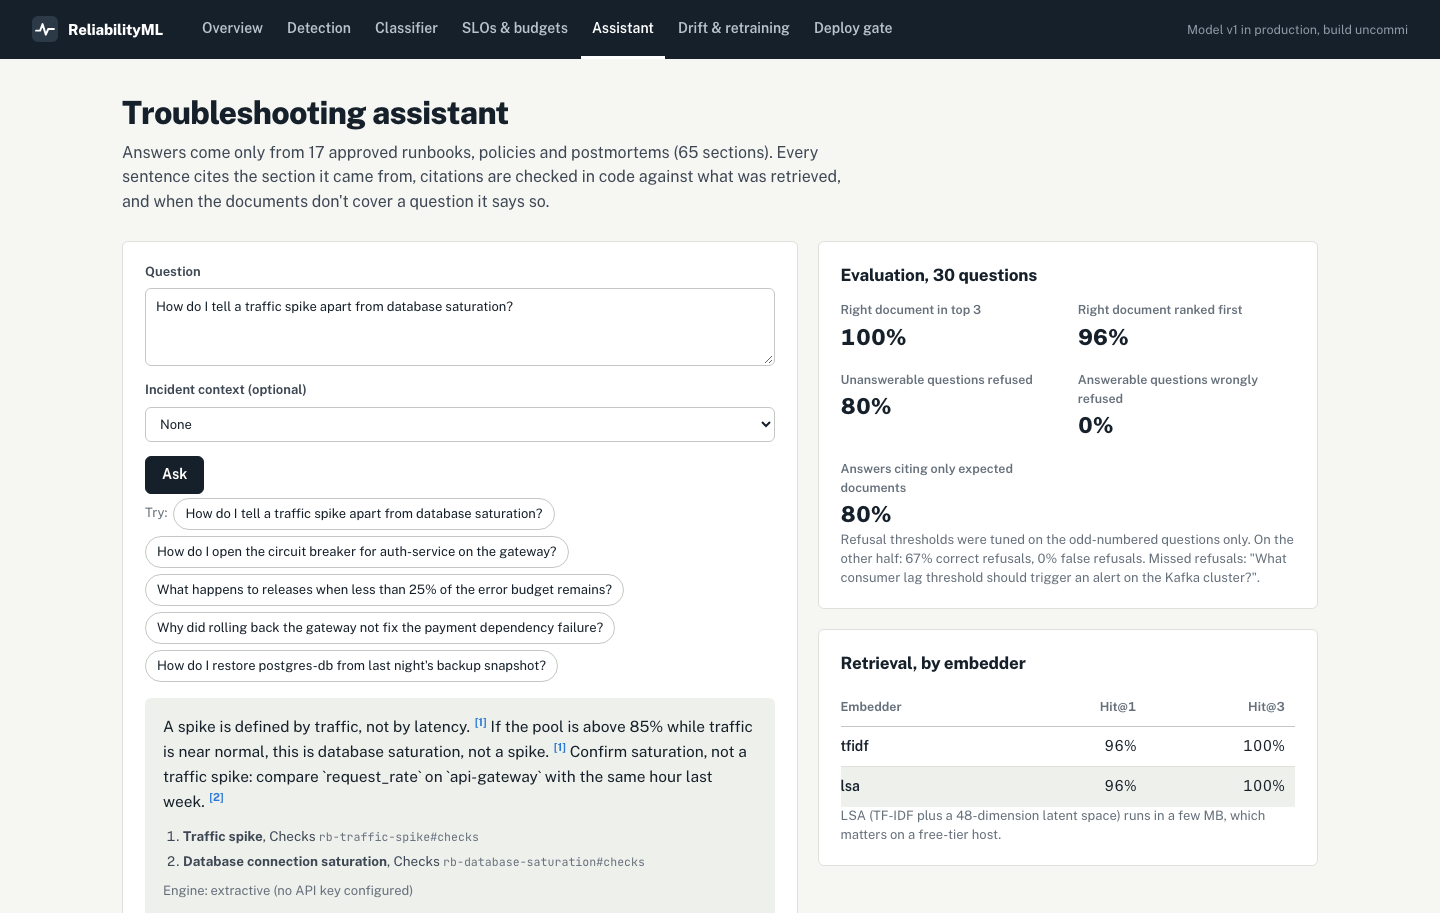
Assistant answering how to tell a traffic spike from database saturation, with numbered citations, and the evaluation results
Evaluation on 30 questions. The right document ranked in the top 3 every time; 4 of 5 unanswerable questions refused and no answerable ones refused. A manual check found 21 of 25 answers fully answer the question.
06

Drift and deployment

Retrain when the data moves, and promote only on evidence.

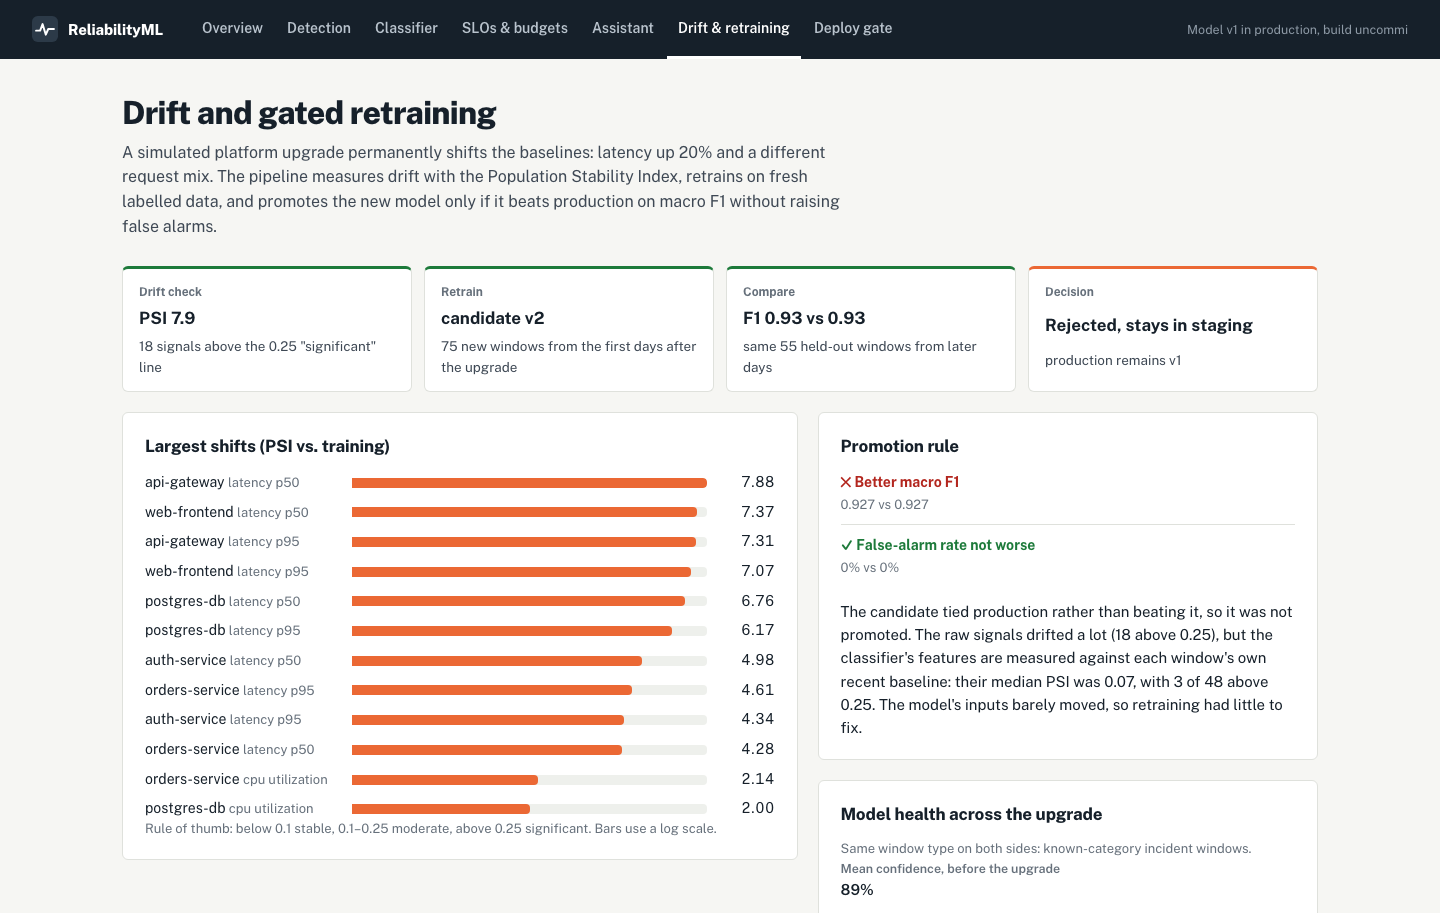
A simulated platform upgrade shifted latency by 20% and changed the request mix. Drift detection flagged it immediately (PSI 7.9), the pipeline retrained, and the candidate tied the production model, so it was not promoted. The reason is measurable: the model's inputs are relative to each window's own baseline, and they barely moved.

Drift cycle: drift detected, retrained, compared, rejected; largest PSI shifts and the promotion rule
One full cycle. Detected, retrained, compared on the same held-out windows, rejected. Promotion needs better macro F1 and no rise in false alarms.
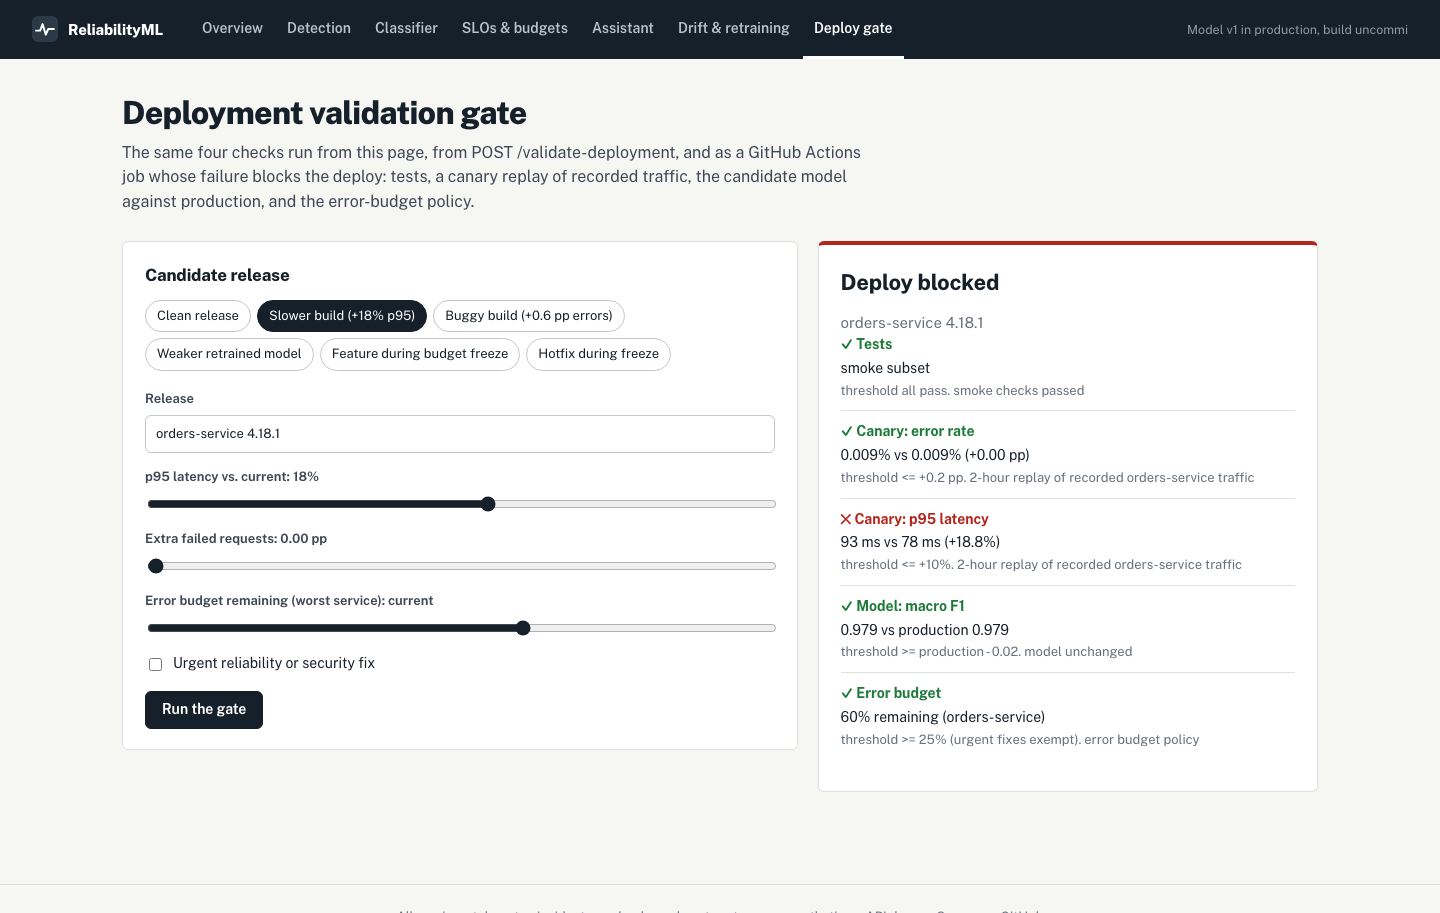
Deployment gate blocking a release whose canary replay shows a 19% p95 latency increase
A blocked release. The canary replay shows p95 latency up about 19% against a 10% limit, so the deploy job stops. CI also asserts that this bad release is blocked.
07

Limitations and next steps

What synthetic data can and cannot show.

The same person wrote the simulator and the models, so the scores are optimistic, and 19 test incidents make each per-class number fragile. The results demonstrate the method, not real-world accuracy.

Known gaps

Where it falls short today

  • Memory leaks are detected late, at container restarts.
  • The key-less assistant quotes sentences but cannot synthesize; 4 of 25 answers were relevant but incomplete.
  • The GCP deployment is defined in Terraform and validated in CI but has not been applied.

With real telemetry

What would change

  • Labels from real postmortems, and human feedback on every prediction.
  • Per-service baselines with seasonality, and a memory trend detector.
  • The LLM answer engine evaluated per prompt version on the same questions.

Explore the build

Clone it, run one command, and every number on this page is regenerated.

The pipeline takes about a minute and writes the data, models, reports and dashboards. docker compose brings up the console, Prometheus, Grafana, Jaeger and MLflow.